J. Geo. Chem. Soc., 2022, Vol. 2, Issue: 1, pp. 0 - 0
Atomic Force Microscopy and Energy-dispersive X-ray spectroscopy study of α-HgS microcrystals on XVII century Georgian red ink manuscript
1 Ilia State University, Ivane Beritashvili Center of Experimental Biomedicine, Tbilisi, Republic of Georgia
2 National Center of Manuscripts, Georgian Technical University, Tbilisi, Republic of Georgia
davit.khutsishvili.6@iliauni.edu.ge
Abstract. Surface measurements of XVII century Georgian manuscripts on paper were made using Atomic Force Microscopy (AFM) and Energy-dispersive X-ray spectroscopy (EDS). From AFM data, the surface quantities (skewness, kurtosis, and average roughness) for red ink and its microcrystals were calculated on different areas of red ink manuscript. From EDS data, chemical element content on the surface of XVII century Georgian red ink manuscript samples were estimated. AFM data were collected from 9.5 µm², 30 µm², and 100 µm² manuscript surface scan areas. EDS data were recorded out of 5 µm², 50 µm², 100 µm², 500 µm², 1 mm², and 2.5 mm² scan areas of manuscript. The angles of 5 microcrystals corresponding to ink surface plane were evaluated. All of them were approximately 80˚. Analysis of both data indicate that on the surface of red ink the α-HgS trigonal microcrystals were formed. In particular, in HgS molecule, mercury content is 86% and sulfur is 14%, which is very close to our EDS data. These results approve that XVII century Georgian red ink manuscript contains HgS molecules rather mercury and sulfur atoms separately. The results indicate that the crystals presented on the surface of XVII century red ink manuscript have α-HgS nature.
Keywords: AFM, EDS, Solid state surface research, Kurtosis, Skewness, Chemical element spectra
Introduction
Due to the rapid increase of historical manuscript deteriorations, study of ink’s decomposition mechanisms is very critical [1]. It is acknowledged that ink that its manuscripts decompose over time was widely used in XVII century Georgia; As a result, those ink manuscripts as the factual artefacts, crumble from the paper due to various chemical processes during centuries. These processes cause to the changes of manuscript’s physical properties, such as decrease in micro hardness and adhesion on paper surface. In order to create optimal and effective environment for manuscript conservation, which will provide its maximum chemical stability, it is important to study manuscript aging mechanisms in a detail.
Atomic force microscope (AFM) is a sufficiently convenient method to study solid state surfaces. AFM imaging has a capability of solid surface measurements at high resolution as hundredth of nanometers. AFM data also straightforwardly can be collected and stored in a computer which can be analyzed easily. In order to estimate chemical element content on solid surface, EDS (Energy-dispersive X-ray spectroscopy) techniques are widely used. EDS is very precise method to obtain measurements of composition of individual chemical elements in percentage over solid surface with high resolution.
Dried ink on paper is an amorphous solid body [5]. Amorphous solid body has isotropic properties, which means that some physical quantity e.g. micro hardens or roughness on surface does not depend on the direction [7]. It is homogeneously distributed over the whole surface. Atoms or molecules are chaotically arranged [8]. As for crystalline bodies, anisotropic properties dominate due to their regular, pattern like atomic structure. For example, surface roughness for crystals can be constant not for the whole surface, but for particular sides of crystal, which depends on crystal axis and directions. Cinnabar microcrystals in red ink solution act as polycrystals, which makes red manuscript as an amorphous material. Over time, cinnabar crystal structures change and start to grow more in size, which increases isotropic properties of dried red ink.
Cinnabar had been widely used as red pigment for paintings [28] and ancient Chinese red ink manuscript [29].
In this research, using AFM and EDS methods, our aim is to identify α-HgS cinnabar microcrystals on 17th century Georgian red ink manuscript. Our research question is whether cinnabar crystals can be detected on an arbitrary ancient Georgian manuscript ink surface. In this research we studied ancient Georgian red ink, not paper. Red ink binding media has not been studied as well.
The structure of α-HgS type of crystals are hexagonal or trigonal. Some types of ink, especially red ink, which was widely used in XVII century Georgia, represented vermillion type. This category of ink contains cinnabar pigments, which are powdered mercury (II) sulfide crystals or microcrystals [27]. When dried ink loses water molecules, vermillion crystals can be seen through AFM or scanning electronic microscope.
Methods
Atomic Force Microscopy
The part of research was conducted using AFM, Bioscope 2 (VECCO). Surface scanning was carried out in a contact mode, using DNP-20 type of cantilever (A and C tip). XVII century Georgian red ink manuscript specimens on paper which were provisionally imported from Georgian National Center of Manuscripts, their surfaces were evaluated as an amorphous solid state. Distribution of measured height magnitudes on 100-micron scan area was recorded (Table 1). With those magnitudes, as primary data, we calculated the following surface morphological quantities: skewness, kurtosis, and average roughness.
Scan areas on the surface of red ink manuscript were 9.5, 30, and 100 µm. Then AFM data was analyzed and calculated these surface parameters mentioned above from surfaces of microcrystals along with certain axis and sides (along certain 1D directions). The whole 2D surfaces were also calculated. AFM data analysis was performed using GWYDDION application.
Surface roughness parameters were calculated using the following formulas:
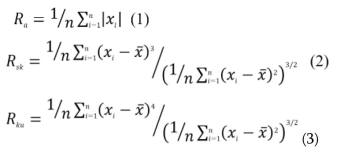
Where Ra Is an average surface roughness, Rsk – Skewness, and Rku – Kurtosis. Xi and Xaverage - absolute and mean values of heights (AFM data).
Energy-dispersive X-ray spectroscopy (EDS)
The chemical element percentage analysis of the surface of red ink manuscript specimen was conducted by a technique of atomic-resolution chemical mapping in scanning electron microscopy (SEM) based on energy-dispersive x-ray spectroscopy (Jeol Jsm-6510 Low Vacuum). The chemical spectral diagrams were made from of 5 µm², 50 µm², 100 µm², 500 µm², 1 mm², and 2.5 mm² scan areas respectively.
Results and discussion
Atomic Force Microscopy
On 100 micron scan area of red ink manuscript, microcrystals were detected (Fig 1 –I).
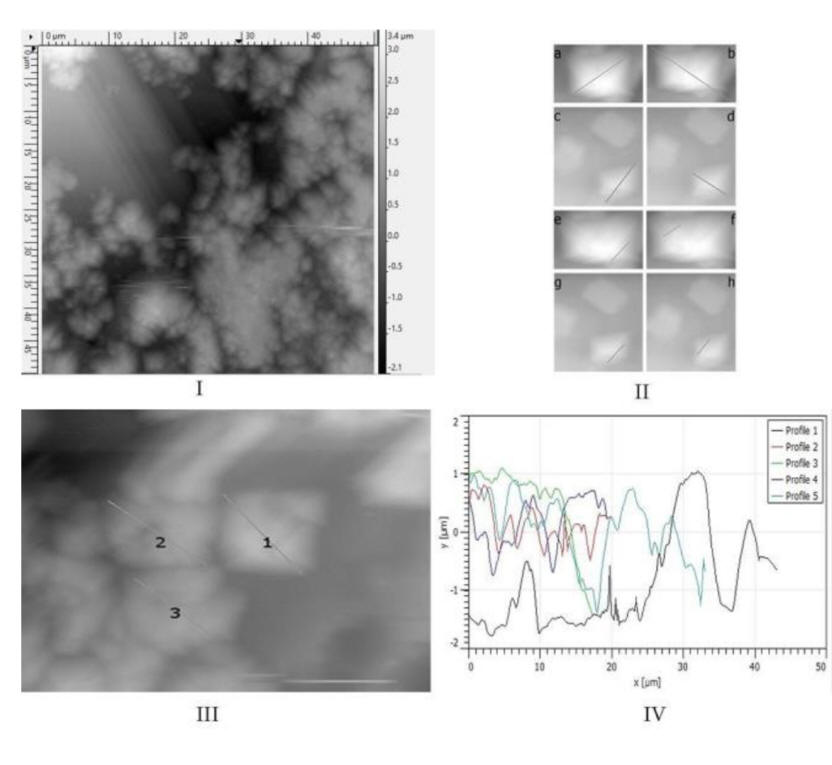
Fig. 1 1: I, II, and III- AFM images of XVII century Georgian red ink manuscript. IV- diagrams for 5 different crystal specimens from the surface of manuscript (not from I, II, and III).
In the Table 1 roughness parameters are presented in case of the whole surface. The kurtosis value is more than 3. It means the height values (from AFM data) on the surface, including collective crystals on red ink manuscript are arbitrary. Poly-crystal surface in general represents isotropy, because those crystal orientations are chaotically arranged.
As the next stage, the surface roughness quantities were calculated for whole surface of each crystal; the values are representing in the Table 2. In table 2 Rku values are less than 3. That makes the height distribution of each crystals on the whole surface platykurtic. Platykurtic distribution of crystals should reflect their anisotropic nature. A microcrystal, which has faces, sides and corners, makes height distribution arranged on a non-random pattern. Such pattern depends on crystal’s certain directions. In other words, homogenous crystals have less rough surface than poly-crystals on crystal’s axis or face plane, but as for whole surface, height distribution is inhomogeneous. As for skewness measurements, the quantities are positive, but less than 1 (Table 1). A positive skewness indicate that the surface is rough. However, it is less than 1. Therefore, according AFM data, the surface is moderately skewed. It explains why the surface, which comprises the poly crystals is isotropic.
Table 1. Roughness parameters from 100-micron ink surface Presented in fig 1-1
|
Ra (nm) |
682.8 |
|
Rsk |
0.1172 |
|
Rku-3 |
0.09207 |
Table 2: Roughness values for 20 crystal specimens presented on Fig. 1-I
|
Ra (nm) |
Rsk |
Rku-3 |
|
293.3 |
-0.2620 |
-0.8655 |
|
211.3 |
-0.4598 |
-0.3931 |
|
327.1 |
-0.6023 |
-0.1582 |
|
353.2 |
-0.7338 |
-0.6916 |
|
357.4 |
-0.6624 |
-0.4093 |
|
195.9 |
-0.5573 |
-0.4968 |
|
251.8 |
-0.1601 |
-1.038 |
|
351.4 |
-0.1279 |
-1.242 |
|
214.7 |
-0.4177 |
-0.4992 |
|
348.6 |
-0.1936 |
-1.054 |
|
225.1 |
-0.5237 |
-0.6296 |
|
284.1 |
-0.4487 |
-0.8613 |
|
195.5 |
-0.4898 |
-0.5065 |
|
170.7 |
-0.4750 |
-0.4180 |
|
203.9 |
-0.3198 |
-0.4792 |
|
153.1 |
-1.059 |
0.6012 |
|
236.8 |
0.1131 |
-0.8516 |
|
137.1 |
-0.4077 |
0.2567 |
|
311.8 |
-0.1858 |
-0.6063 |
|
241.2 |
-0.5078 |
-0.7329 |
On Fig 1-II two microcrystals are shown (scan area is 9.5 micron). Calculating of roughness parameters were conducted along axis sections. It is demonstrated on fig 1-II a-d and e-h, And Table 3, clearly indicates that the height distribution along crystal axis is leptokurtic (Rku>3), while along the crossing boundary of crystal facets it is platykurtic (Rku<3).
Table 3. Surface roughness parameters along the crystal axis (a-d) and along the crossing boundary of crystal facets (Fig 1-II).
|
Ra (nm) |
7.68513 |
a |
|
Rsk: |
-0.0593478 |
|
|
Rku: |
5.11424 |
|
|
Ra (nm) |
6.19826 |
b |
|
Rsk: |
-0.8166 |
|
|
Rku: |
5.955 |
|
|
Ra (nm) |
10.7 |
c |
|
Rsk: |
-0.465 |
|
|
Rku: |
4.017 |
|
|
Ra (nm) |
7.724 |
d |
|
Rsk: |
-0.292 |
|
|
Rku: |
4.033 |
|
|
Ra (nm) |
19.85 |
e |
|
Rsk: |
-0.0932 |
|
|
Rku: |
2.543 |
|
|
Ra (nm) |
15.2842 |
f |
|
Rsk: |
-0.186487 |
|
|
Rku: |
2.12826 |
|
|
Ra (nm) |
26.6495 |
g |
|
Rsk: |
-0.301668 |
|
|
Rku: |
1.91723 |
|
|
Ra (nm) |
17.1270 |
h |
|
Rsk: |
-0.186068 |
|
|
Rku: |
2.48356 |
Table 4: surface roughness parameters for 3 crystals from fig 1-IV
|
Rku-3 |
Rsk |
Ra (nm) |
Size (µm) |
n |
|
-0.5918 |
-0.1957 |
286.9 |
3.52 |
1 |
|
-0.7122 |
-0.1684 |
249.8 |
4.35 |
2 |
|
-0.6904 |
-0.4033 |
131.9 |
3.22 |
3 |
On Fig 1-III, the AFM image of manuscript surface is represented (scan area 30 micron). Each crystal’s height distributions for whole surface is leptokurtic (Rku<3, Table 4). It also indicates to the anisotropy for each solid body represented on this figure.
On Fig 1-IV, the diagram of five crystal profiles is presented. The angles of 5 microcrystals corresponding to ink surface plane were evaluated; all of them were approximately 80˚.
Therefore, AFM analysis revealed, that solid bodies on the surface of red ink of XVII century Georgian manuscript are microcrystals.
Energy-dispersive X-ray spectroscopy (EDS)
EDS spectroscopic diagrams of red ink on Georgian 17th century manuscript is represented on Fig 2. On Table 5, the data for Hg and S percentage content of red ink manuscript are shown. It is especially notable that the percentages of sulfur and mercury contents, with high proximity is equal to their percentage content in HgS molecule. In particular, in HgS molecule, mercury content is 86% and sulfur is 14%, which is very close to our EDS data (Table 5). These results approve that XVII century red ink manuscript contains HgS molecules rather mercury and sulfur atoms separately.
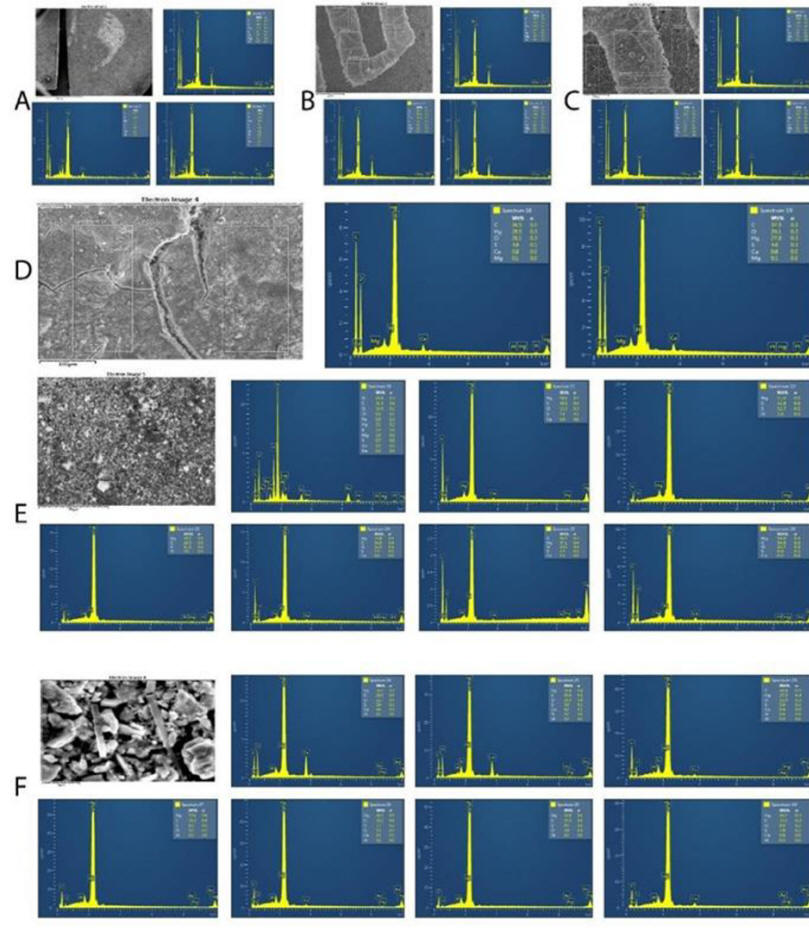
Fig.2. Table 5 A-F 2.5 mm (A), 1 mm (B), 500 µm (C), 100 µm(D), 50 µm (E), and 5 µm (F)
Table 5: EDS data of Hg and S (%) consistence on the surface of red seventeenth century Georgian ink manuscript.
|
ωHg (%) |
ωS (%) |
(ωHg/(ωHg+ωS))*100% |
(ωS/(ωHg+ωS))*100% |
Scan Size |
|
20.08 |
3.37 |
85.63 |
14.37 |
1 mm |
|
20.81 |
3.41 |
85.92 |
14.08 |
|
|
22.65 |
3.75 |
85.80 |
14.20 |
|
|
20.11 |
3.22 |
86.20 |
13.80 |
|
|
24.23 |
4.09 |
85.56 |
14.44 |
500 µm |
|
22.48 |
3.72 |
85.80 |
14.20 |
|
|
25.76 |
4.10 |
86.27 |
13.73 |
|
|
27.81 |
4.61 |
85.78 |
14.22 |
100 µm |
|
29.52 |
4.91 |
85.74 |
14.26 |
|
|
36.02 |
5.89 |
85.95 |
14.05 |
50 µm |
|
2.12 |
0.71 |
74.91 |
25.09 |
|
|
40.65 |
7.28 |
84.81 |
15.19 |
|
|
71.01 |
12.65 |
84.88 |
15.12 |
|
|
65.74 |
11.27 |
85.37 |
14.63 |
|
|
45.83 |
7.05 |
86.67 |
13.33 |
|
|
37.09 |
4.43 |
89.33 |
10.67 |
|
|
27.81 |
4.61 |
85.78 |
14.22 |
100 µm |
|
29.52 |
4.91 |
85.74 |
14.26 |
|
|
48.08 |
7.81 |
86.03 |
13.97 |
5 µm |
|
36.21 |
5.83 |
86.13 |
13.87 |
|
|
38.78 |
5.84 |
86.91 |
13.09 |
|
|
37.20 |
5.90 |
86.31 |
13.69 |
|
|
52.58 |
8.30 |
86.37 |
13.63 |
|
|
48.10 |
7.71 |
86.19 |
13.81 |
|
|
58.03 |
9.49 |
85.94 |
14.06 |
Conclusion
The results indicate that the crystals presented on the surface of our sample XVII century red ink manuscript have α-HgS cinnabar nature. Identification of cinnabar microcrystals on red ink manuscript using AFM and EDS methods is our scientific finding and solution of our research question. These findings will answer questions on what happens to durability of ancient manuscript during aging process and external circumstances such as: heat, temperature, humidity and lighting. That requires future research.
Acknowledgments: the author thanks N. Jalabadze, professor of Georgian Technical University for help in initial experiments and I. Jikidze, head specialist at laboratory of Georgian National Center of Manuscripts for temporarily delivering XVII century Georgian manuscript specimen.
This work was supported by the Shota Rustaveli National Science Foundation (Grant DP2016_17).
Competing Interests: The author declares no competing interests.
References:
[1] V. Rouchon, M. Duranton, C. Burgaud, E. Pellizzi, B. Lavédrine, K. Janssens, W. de Nolf, G. Nuyts, F. Vanmeert, and K. Hellemans, “Room-Temperature Study of Iron Gall Ink Impregnated Paper Degradation under Various Oxygen and Humidity Conditions: Time-Dependent Monitoring by Viscosity and X-ray Absorption Near-Edge Spectrometry Measurements", Anal. Chem., Vol. 83, No. 7, pp. 2589–2597, 2011
[2] F. Ohnesorge, G. Binnig, “True Atomic Resolution by Atomic Force Microscopy Through Repulsive and Attractive Forces”, Science, Vol. 260, No. 5113, pp. 1451- 1456, 1993:
[3] K. Sumetpipat, D. Baowan, B. J. Cox and J. M. Hill, “Mathematical methods on atomic force microscope cantilever systems”, RSC Advances, Vol. 6, No. 52, pp. 46658-46667, 2016,
[4] S. Maghsoudy-Louyeh, M. Kropf, B. R. Tittmann, “Review of Progress in Atomic Force Microscopy”, The Open Neuroimaging Journal, Vol. 12, pp. 86-104, 2018
[5] Z.Cummins, “Liquid, glass, gel: The phases of colloidal Laponite”, Journal of Non-Crystalline Solids, Vol. 353, No. 41–43, pp. 3891-3905, 2007
[6] J.K. Lee, D.M. Barnett, H.I. Aaronson, “The elastic strain energy of coherent ellipsoidal precipitates in anisotropic crystalline solids”. Metall Mater Trans A, Vol. 8, pp. 963–970, 1977
[7] R. E. Newnham, “Properties of Materials: Anisotropy, Symmetry, Structure”. New York: Oxford University Press. 2005, 60–64.
[8] T. H. Courtney, “Mechanical Behavior of Materials”, New York: Waveland Press Inc. 2005, 47–61.
[9] W. Vogel, “Crystallization of Glasses”, Pennsylvania State University: Glass Chemistry, Otto-Schott-Institut, Friedrich-Schiller-Universität Jena, Fraunhoferstr. 6, 07743, Jena, Germany: pp. 280-362, 1994.
[10] L. Cormier, „Nucleation in Glasses – New Experimental Findings and Recent Theories “, Procedia Materials Science, Vol. 7, pp. 60-71, 2014
[11] K. Thieme, I. Avramov, & C. Rüssel, “The mechanism of deceleration of nucleation and crystal growth by the small addition of transition metals to lithium disilicate glasses”. Sci Rep, Vol. 6, pp 1-14, 2016
[12] P. G. Vekilov, “Nucleation”, Crystal Growth & Design, Vol. 10, No. 12, pp. 5007-5019, 2010
[13] Kumar, Borra & Rao, T “AFM studies on surface morphology, topography and texture of nanostructured zinc aluminum oxide thin films”. Digest Journal of Nanomaterials and Biostructures Vol. 7, No. 4, pp. 1881-1889, 2012
[14] A.K. Mahapatra, A.K. Dash, “α-HgS nanocrystals: Synthesis, structure and optical properties”, Physica E: Low-dimensional Systems and Nanostructures, Vol. 35, pp. 9-15, 2006
[15] A. P. Ckowska, “Hydrothermal crystallization of cinnabar, HgS”, Journal of Crystal Growth, Vol. 7, 93-96, 1970
[16] A. M. Glazer, K. Stadnicka, “On the origin of optical activity in crystal structures” J. Appl. Cryst. Vol. 19, pp. 108-122, 1986.
[17] D. McMullan, (2006). "Scanning electron microscopy” 1928–1965". Scanning. Vol 17, No. 3: pp 175– 185, 2006.
[18] L. Corbari, M.-A. Cambon-Bonavita, G. J. Long, F. Grandjean, M. Zbinden, F. Gaill, and P. Compère, “Iron oxide deposits associated with the ectosymbiotic bacteria in the hydrothermal vent shrimp Rimicaris exoculata”, Biogeosciences, Vol. 5, 1295–1310, 2008
[19] J. Goldstein, “Scanning Electron Microscopy and X-Ray Microanalysis”. Springer. 2012, ISBN 978-0-30647292-3, pp. 1-673.
[20] D. V. Thompson, “The Materials and Techniques of Medieval Painting”. Chicago, IL: Dover (R. R. Donnelley-Courier). 1956, pp. 100–102.
[21] R. Nöller “Cinnabar reviewed: characterization of the red pigment and its reactions“, Studies in Conservation, Vol. 60, No. 2, pp. 79-87, 2013
[22] Y. Hou, L. Yu, W. Xie, L. Cuellar Camacho, M. Zhang, Z. Chu, Q. Wei, and R.Haag, “Surface Roughness and Substrate Stiffness Synergize To Drive Cellular Mechanoresponse” Nano Letters, Vol. 20, No. 1, pp. 748-757
[23] John E. McMurry, Organic Chemistry (3rd ed.), Belmont: Wadsworth, 2016, pp. 1-333
[24] I. Jikidze, R. Kldiashvili, S. Tavadze - The Georgian Manuscript Heritage, Abstracts of Papers, Korneli Kekelidze Georgian National Centre of Manuscripts (Tbilisi, Georgia), International Conference, 28-30 June, 2018 Tbilisi, Page:132-133.
[25] R. Kldiashvili, D. Khutsishvili M. Zhvania I. Jikidze S. Tavadze, 2.17th Century Georgian Manuscript – Atomic Force Microscopic Study 4th International Symposium and School of Young Scientists, “Brain ε Neuroplasticity: Structural and Molecular Aspects”, Tbilisi. Georgia May 1-7. 2019, 27.
[26] L. Burgio, R. J. H. Clark, R. R. Hark, “Raman microscopy and x-ray fluorescence analysis of pigments on medieval and Renaissance Italian manuscript cuttings” Proceedings of the National Academy of Sciences, Vol. 107, No. 13, 5726-5731, 2010;
[27] C. Davide. “Paintings Turning Black? Blame Mercury: Nature News & Comment.” Nature News & Comment, p 1-2, 2013
[28] R. J. Gettens, G. L. Stout, “Painting materials: a short encyclopedia”, New York (2nd Ed.), 1966, pp. 170-173
[29] R. J. H. Clark, P. J. Gibbs, K. R. Seddon, N. M. Brovenko, Y. A. Petrosyan, “Non-Destructive In Situ Identification of Cinnabar on Ancient Chinese Manuscripts”, Journal of Raman Spectroscopy, Vol. 28, pp. 91-94, 1997
Recieved: 16-03-2022 | Web published: 20-03-2022 | Views 1146