J. Geo. Chem. Soc., 2021, Vol. 1, Issue: 1, pp. 52 - 58
Weathering of greenhouses plastic films in different exposure periods
Mechanics laboratory(Ime).University of Ammar Telidji Laghouat.Algeria
Abstract. Analysis of the IR spectra of weathered films exposed at different periods of the year reveals that, the main regions of the IR spectrum affected by solar irradiation and temperature variation are the complex carbonyls and unsaturations composite absorption bands. Their respective kinetics vary in different manner according to the period at which the exposure is started. Curve fitting has been performed to refine the analysis of the IR spectra and to identify all the chemical species constituting the complex absorption bands. The analysis of the results let appears that whatever the exposure period of the year is, it does not affect the type of developing products, but it has strong effect on their kinetic rate of formation. The warm season is the more effective in terms of carbonyl formation and crystallinity index. This indicates that the Norrish type I (NI) process is very important in this season and it adds to the Norrish type II (NII) process. Both contribute to the carbonyl and vinyl groups formation via chain scission reactions; however the NII process is active during all the period of the year.
Keywords: LDPE, Photooxidation, FTIR, Curve fitting, Crystallinity index.
INTRODUCTION
The most widely used material for greenhouse covering is Low-density polyethylene (LDPE), because of its good physicochemical, mechanical and optical properties, for its cheapness and ease of processing. This makes it the leader material in the agricultural field [1]. This polymer is very sensitive toward much of the climatic parameters such as, solar radiations (ultraviolet rays), temperature, atmospheric oxygen, humidity, rain, sand wind, and pollutants etc... These environmental factors affect adversely the mechanical, chemical and optical properties [2]. As a matter of fact, solar irradiation in the UV range [290 -400 nm] is certainly the most aggressive parameter interacting with the structural defects, acquired during polymerization and processing, leading to molecular structure modification responsible to the lowering of the mechanical and physical properties [1,3]. Temperatures closely related to solar energy are other significant climatic factors acting on the degradation process, contributing to drastically increase the formation rate of the photo-oxidation products [4]. Environmental pollution, wind forces ca also contributes in the reduction of the lifetime of the material [3, 5].
Ageing being mainly a polymer chain degradation process characterized by the oxidation of the macromolecules and accompanied by morphological changes[5]. As such, FTIR spectroscopy can be regarded as a powerful technique to identify the different oxidation products developing during ageing and allowing also to quantify their changing concentration. The oxidation mechanism being very complex, an exhaustive analysis of the evolution of all the spectrum regions could highlight the respective contribution of most of the different chemical species [6].
It remains still difficult to distinctly identify the different chemical species constituting most of the complex absorption bands, because of the close vicinity of their respective signal which most of the time overlap. This makes necessary to refine the spectra analysis by means of mathematical treatments [7, 8].
Another aspect of ageing seldom discussed by others is the effect of the exposure period on the formation and growing of the carbonyl species or unsaturations.
Verdu has studied the effect of the period on the film degradation exposed in France for three different periods. In this work, the effect of exposure period in the kinetics of the oxidations products of the greenhouses plastic films has been checked. The exposition took place in Sub Saharan region (Laghouat- Algeria). The carbonyl and vinyl rate formation and the crystallinity index have been used as comparative indicators to highlight the effect of the period on the degradation process.
EXPERIMENTAL
A. Material
The raw material (LDPE pellets) usedin this study are supplied by the Saudi Basic Industries corporation (Sabic) as (LDPE 2100 T N00W).The films are produced bythe Sofi-Plast Companyat Sétif, (Algeria).This polymer is a neat grade exempt of stabilizing agents. The melt was extruded at about 1750Cand blown in a continuousprocess characterized by a bubble diameter of 4.4 m, a wall thickness of 180 μm, and a drawing speed of 15 cm/s.
B. Weathering protocols and sampling.
Films cuts were mounted on metallic frames facing south accordingto the ISO 4607 standard.Exposure to solar radiation has been performed at Laghouat (33°48’ N,20°56’E), Algeria. Seven ageing protocols have been started at different periods of the year (Table I). The average duration of a protocol is seven months.For each protocol amonthly sampling is done.
Table 1: The ageing protocols
| Protocol Number | Beginning of the protocol | End of the protocol |
| 1 | Jan | Jul |
| 2 | Feb | Aug |
| 3 | Mar | Sept |
| 4 | Apr | oct |
| 5 | May | Nov |
| 6 | Jun | Dec |
| 7 | Jul | Jan |
C. Fourier transforms infrared spectroscopy (FTIR).
An FTIR spectrometer, maintained by Perkin Elmer (Spectrum Two), was used for the infrared analysis.The infrared spectra were collected in transmission mode over the range from 4000-400 cm-1 at a 4 cm-1 optical resolution and using 32 scan repetitions. In this study, the representation of the spectra using the absorbance mode is most suitable to calculate the optical density of allthe chemical species developing duringageing, and to highlight their kinetic evolution [9].
Mathematical curve - fitting
To identify the species constituting the complex absorption bands in the different regions of the IR spectrum a mathematical curve fitting was performed to deconvolute and identify the entire initial existing products and those evolving during exposure.The curve fitting was performed using the second derivative method in the OriginPro software package (version 8.6).The second order derivatives IR spectra were obtained using the Savitzkye Golay algorithm (9-point smoothing). However, the curve fitting method has been described in details in a previous work [8]. The curve fitting not allow the identification of all the chemical species developing during ageing, and further its comparison regardless the exposure periods.
For polymers, the simplest way to follow the evolution of the chemical species during ageing is to measure their absorbance at different exposure times [10, 11]. According to the Lambert-Beer law, the concentration C of a species is given by꞉
C = A/e L (1)
Where, A is the IR absorbance of the chemical species; Obtained by the maximum of the peakof absorption band. L (cm) is the sample thicknessand e (l.cm-1 mmol-1) is the extinction coefficient [12, 13].
D. Crystallinity index
The crystallinity index at the different stage of the ageing protocol has been determined thanks to the FTIR data got from the absorption bands at respectively 720 and 730 cm-1, using the following relationship:
C% = 100 – (B/(1+K)´100) (2)
Where K =IA730 / IA720 , B =(1-K)/1.233, and , IA730 and IA730 are the integrated area of the absorption band at 730 cm-1, and 720 cm-1 corresponding to the rocking mode vibration of a (–C-H) bond in the crystalline and the amorphous regions respectively. The constant 1.233 corresponds to the relation of the intensity bands of a fully crystalline polyethylene [14,15].
RESULTS AND DISCUSSIONS
A. Identification of the chemical species by curve fitting
The IR spectra reported in fig. 1 of unexposed and exposed film from January to July corresponding to the protocol (1) has arbitrarily be chosen from the others to identify the chemical species which develop during ageing. The samples have been named A0 (unexposed film), and A1 to A7 for the exposed films where the number from 1 to 7 refer to the duration of exposure (months).
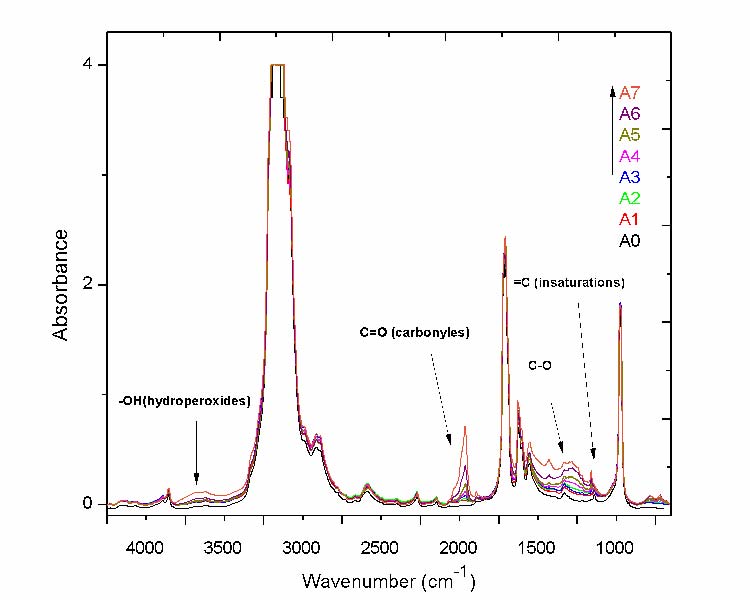
Fig.1 The IR spectra of LDPE films (A0 to A7 samples) for different ageing time
The aging process of the exposed film is governed by a complex mechanism of chemical reactions. This is reflected by the growth and disappearance of absorption bands. The spectral regions which are the most affected, are those of the hydroperoxides (3700-3300 cm-1), carbonyl groups (1800-1680 cm-1), (C-O) groups (1220-1000 cm-1), and unsaturations (985-880 cm-1). Curve fitting applied to these different respective spectral regions for the most aged samples are reported in figs 2 to 5.
hydroperoxide region (3700 -3300 cm-1)
The hydroperoxides region can be divided into two different regions; the first ranging from 3700 cm-1 to 3580 cm-1 (fig. 2.a; solid line) and the second one from 3550 cm-1 to 3300 cm-1 (fig. 2.b; solid line), both of them consist of a broad absorption band with two maxima.
After curve fitting:
- It appears three maxima in the first region (fig. 2.a; dashed line). Two of them coincide with the previous maxima 3650 cm-1 and 3600 cm-1, while the third appears between them at 3645cm-1, all belong to the O-H stretching of alcohols [16].These absorbances correspond to primary and tertiary alcohols for the two firsts and to secondary alcohols for the last [17]. It can be still noticed that the envelope encompassing their absorbance do not change noticeably with exposure time, probably because of their simultaneous formation and consummation. This has been checked for all the others protocols and the same results have been found.
- It appears for the second region (fig. 2.b; dashed line) a number of other peaks corresponding to different types of hydroperoxide products. However, it remains difficult to attribute all these vibrations to their respective structures. Only three of them are recognizable the maximum at 3432 cm-1 belonging to O-H stretching of the associated hydroperoxides and that at 3372 cm-1 to the unassociated hydroperoxides. The last one at 3533 cm-1has been identified belonging to O-H stretching vibration of free hydroperoxides (most probably that of carboxylic acid) [18, 19 and 20].
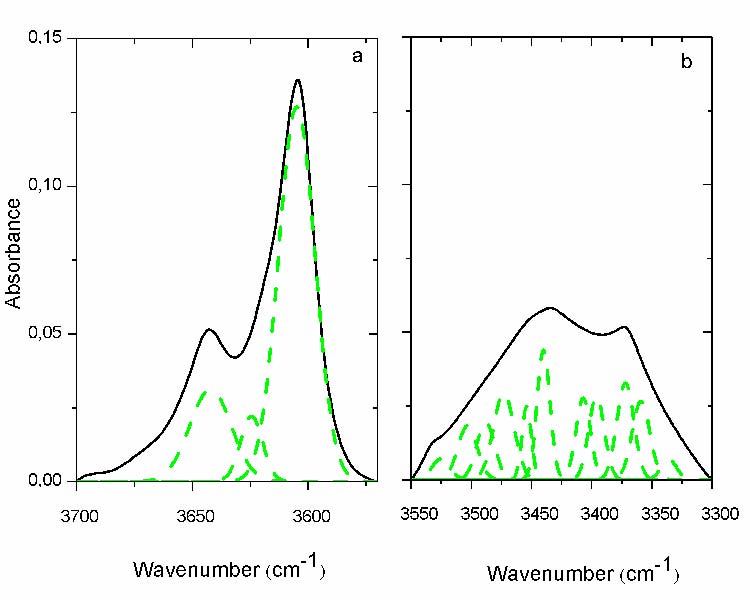
Fig.2: Curve fitting of the hydroperoxide region: a) 1st region, b) 2nd region[3550-3300cm-1]. (- solid line before curve fitting; - -dashed line after curve fitting), Carbonyls region (1800 – 1680 cm-1)
The most indicative absorption band of ageing is that of carbonyls. Nonexistent in the unexposed sample, it significantly increases with ageing and becomes a massive absorption band pointing at 1713 cm-1(fig. 3). Itis bordered by many shoulders on its left side which reveals that it is composed by many species (fig. 3 solid line). In fact, curve fitting has revealed that it encompasses no less than 11 different peaks (fig. 3 dashed line). However, a further analysis (second derivative and fourth derivative) has allowed finding the presence of 15 different products. The peak positions and their corresponding chemical structures are reported in table 2 [7, 8, and 12].
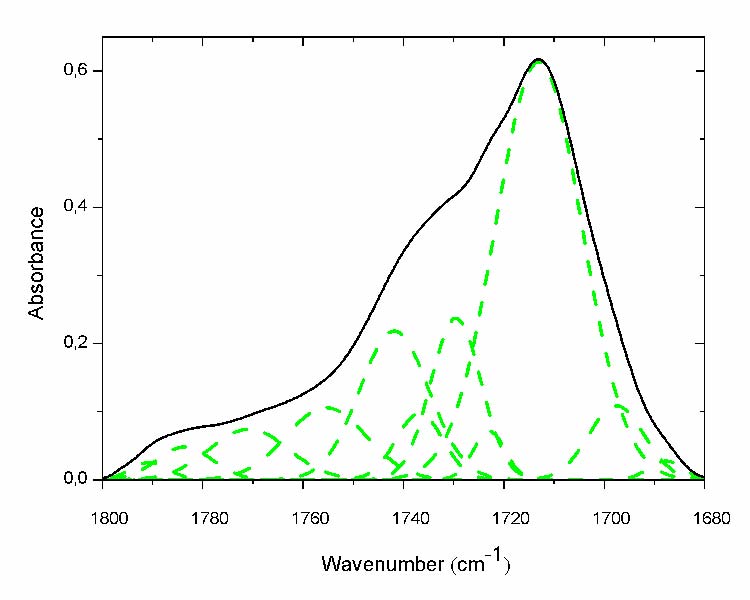
Fig.3: Curve fitting of the carbonyl absorption band of the most aged film (- solid line before curve fitting; - -dashed line after curve fitting).
Table 2: Peak position and assignment of carbonyl species after curve fitting
| Component no | Peak position (cm-1) | Assignment |
| 1 2 3 4 5 6 7 8 9 10 11 12 13 14 15 | 1686 1697 1702 1709 1713 1722 1734 1739 1750 1756 1761 1767 1777 1785 1790 | Keton, acide α,β unsaturated a,b γ ketoacide, keto groupa,b Conjugated ketonesa,b γ ketoacide, keto groupa,b Carboxylic acid (associated)a,b,c Ketonesa,b,c Aldehydesa,b Estersa,b,c Peracidesa,b Carboxylic acid (free)a,b,c not identifieda Carboxylic acid (isolated)a,b Perestersa,b γ –Lactonesa,b,c not identifieda |
a Separated by derivative analysis in this work
b Assignment according to Ref [8-12].
c Assignment according to Ref[7]
C-O bonds (1220-1000 cm-1)
This region displayed various shoulders indicating the presence of the multiplicity of hidden peaks (Fig. 4). The hidden sub-peaks derivate from the curve fitting (fig.4 dashed line) and its assignment are presented in table III. Some of them increase through ageing; the absorptions at 1178, 1187cm-1corresponding to the esters and g-lactones groups respectively increase progressively to what has been observed in the carbonyl region [18, 12].
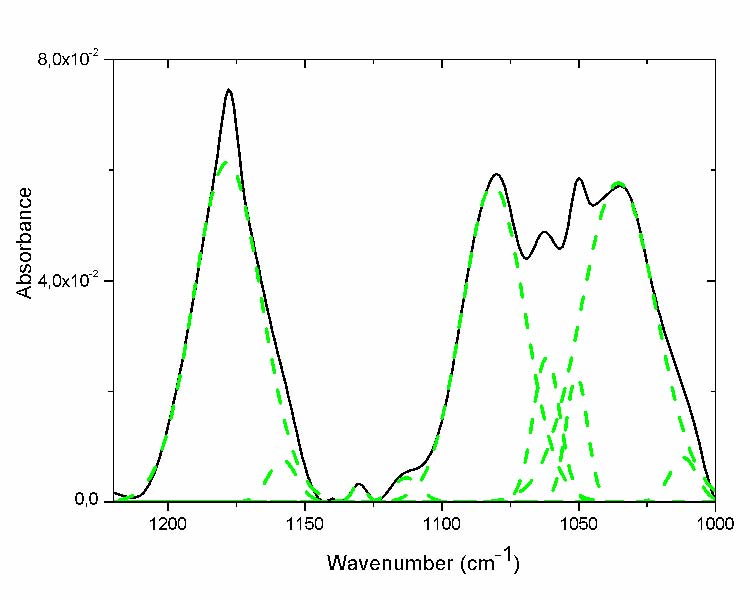
Fig. 4 Curve fitting of the C-O region of the most aged film (- solid line before curve fitting; - -dashed line after curve fitting ).
Table 3: Peak position and assignment of the C-O bonds highlighted by curve fitting [12,16,17 and 21]
| Components no | Peak position(cm-1) | Assignment |
|
1 2
3 4 5
6
7 8 9 10 11 |
1007 1031
1050 1063 1078
1090
1114 1130 1156 1178 1187
|
not identifieda not identifieda
Primary alcohols with g,h,I,j Secondary alcohols g h,I,j Tertiary alcohols g h,I,j not identifieda
not identifieda Ether (R-O-CH3) g,l,j Ether (R-O-R) g,l,j Esters g,,h,j,k γ –Lactonesg,h,j,k
|
g Separated by derivative analysis in this work
h Assignment according to Ref [17]
I Assignment according to Ref [16]
j Assignment according to Ref [21]
K Assignment according to Ref [12]
Unsaturations (985–880cm-1)
These types of chemical species are visible in the regions of the spectrum [880-980 cm-1]. The curve fitting of these regions does not reveal the presence of absorption bands other than those corresponding to the existing and visible maxima (fig. 5).
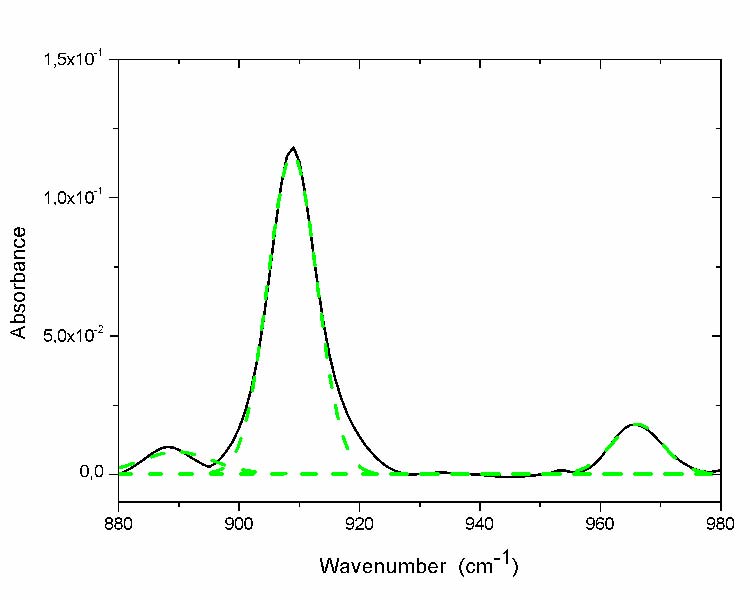
Fig. 5 Curve fitting of region of unsaturations absorption band of the most aged film (- solid line before curve fitting; - -dashed line after curve fitting).
The peak positions and their corresponding chemical structures are reported in table 4.
Table 4: Peak position and assignment of the unsaturations [7, 17, 20, 22 and 23]
| Components no | Peak position(cm-1) | Assignment |
| 1 | 888 | Vinylidenel,m,n |
| 2 | 909 | vinyl l,m,n |
| 3 | 965 | t-vinylene l,m,n |
l Separated by derivative analysis in this work.
m Assignment according to Ref [7]
n Assignment according to Ref [17,20]
O Assignment according to Ref [22, 23]
B. Effect of the exposition period on the kinetic of the chemical species
Kinetic of Carbonyls group
Natural exposure is the occurrence of the formation of a variety of photooxidation products (Table 5). However, those which are the most important in term of concentration are the aldehydes, the ketones, the carboxylic acids and the esters [7, 8]. The representation of their formation kinetic, according to the different protocols gives a good insight on the season effect (fig. 6).
Natural weathering is the occurrence of the formation of a variety of photooxidation products (Table V). However, the most important ones in terms of concentration are the aldehydes, the ketones, the carboxylic acids and the esters. The representation of their kinetic formation, according to the different protocols gives a good insight on the period effect (Fig.6). It can be observed that the period affects the variation of carbonyl species concentration as a function of exposure time. Moreover, the induction time was found to be maximum for the protocol started in the cold season (i.e. protocol 1and 2), and to progressively decrease until to practically disappear in the case of protocol 7 (started in July). The protocol 4 (started in April) displays a particular behavior. Because, after a very short induction time, their formation become auto-accelerated to be slightly saturated at the end with the higher concentration comparatively to the others (rapid degradation). This clearly means that the protocols started in Springer are more harmful in term of oxidation than the others.
For each experimental run, the curves of chemical species concentration were plotted with the maximum and the minimum values achieved at the end of aging process (Fig. 6-7). The reproducibility of all the other experimental points is in the same range.
Kinetic of Unsaturationsgroups
The variation of the unsaturation concentration of the vinylidenes and the vinyls is reported in Fig. 7. Vinylidene groups are present with a noticeable concentration at the beginning of exposure, then they are progressively consumed until their total disappearance. However, the rate of consumption is somewhat different from one protocol to another. The drop of the curve at the beginning of exposure becomes progressively more abrupt as the protocols shift from winter toward summer. Since, they are found to be totally consumed in the protocol 4 (Fig. 7a).
Vinyl groups, showing a small initial concentration grow rapidly with ageing time. Their kinetics deeply differ from one protocol to another (Fig. 7b). Their s-shaped curves show an induction time decreasing from the protocol started in winter to that of summer (i.e. protocol 1 and 7) as observed for the curves of the carbonyls species.
C. Crystallinity index
The variation of the cristallinity index determined for each protocol is represented in fig. 8. The exposure period affects notably the progression since it can be observed that the variation is very low when starting in the cold season and becomes progressively more important when the protocols shift toward the hot season. The aspect of the curve is affected by the exposure period. For the protocols (starting in January and February) the curves look like linear to progressively become s-shaped when going toward summer.
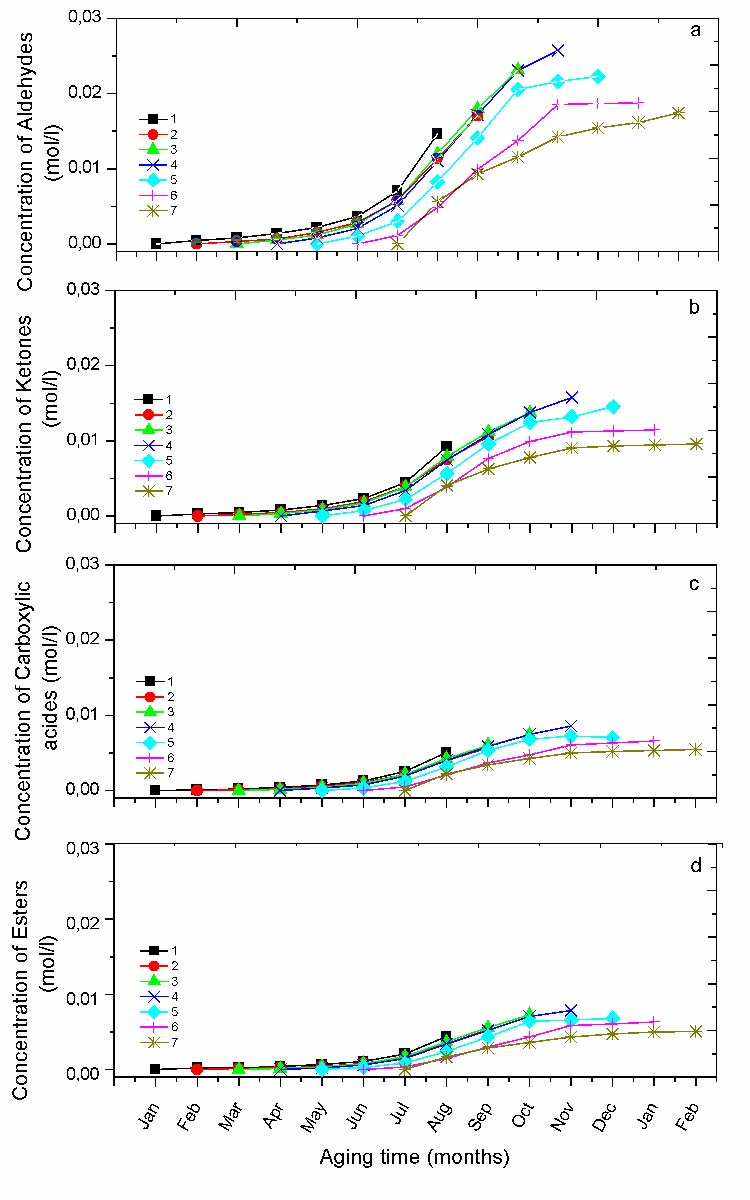
Fig. 6 Variation of the concentration of carbonyl groups for different protocols; a) Aldehydes, b) Ketones, c) Carboxylic acids, d) Esters.
The progression in April is singular since it starts auto-accelerated and speed-up more just after July and stays that way until the end of the protocol showing the highest crystallinity ratio in comparison to the other protocols. Afterward, the following protocols show saturated curves at the end of exposure.
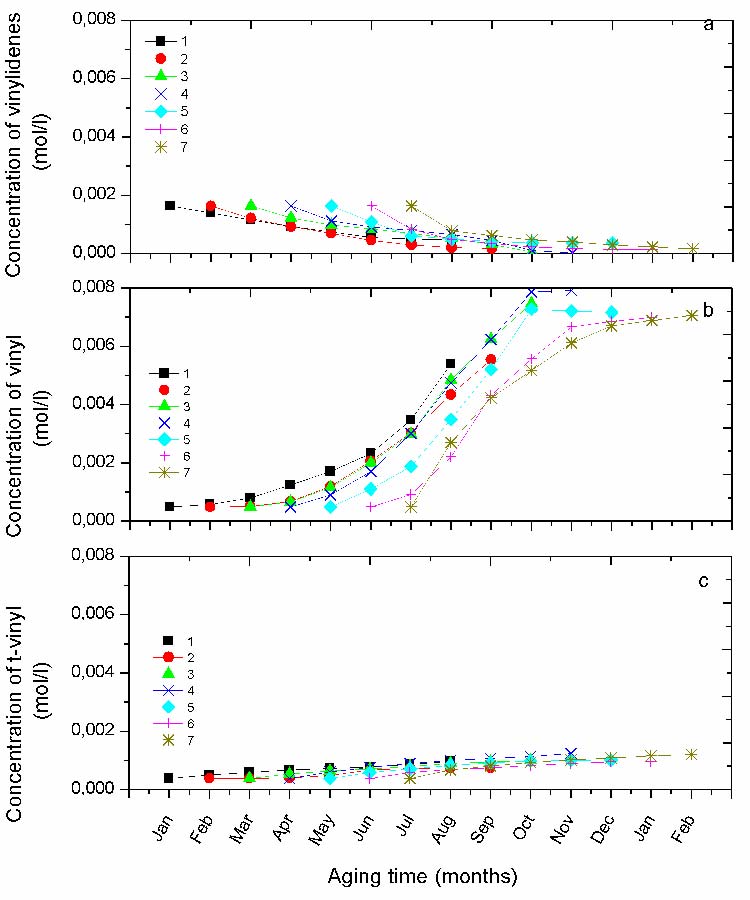
Fig. 7 The absorbance variation for the different protocols of the unsaturations a) vinylidenes (888 cm-1), b) vinyl (909 cm-1) , d) t-vinylene (965cm-1).
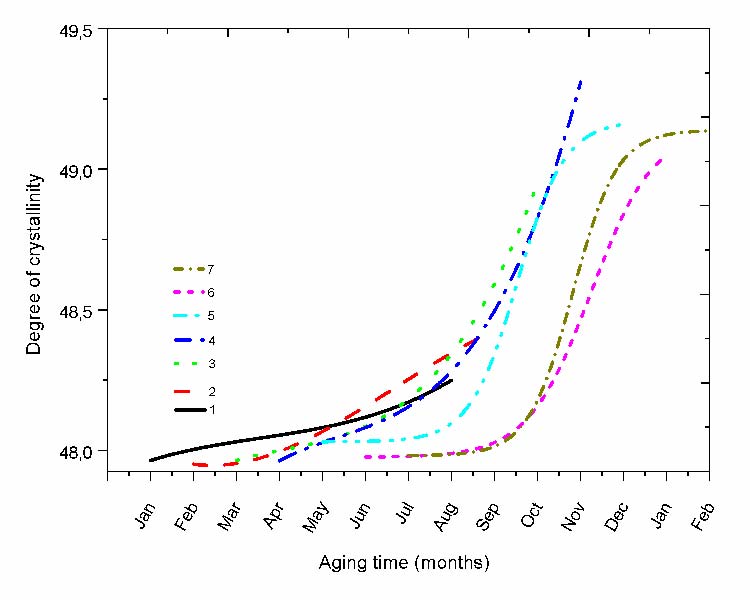
Fig. 8 Variation of the crystallinity ratio for the different protocols.
The photo-oxidation of polyethylene is known a complex oxidation process where chain-scission and crosslinking reactions are in competition. The impact of such chemical reactions changes the original polymer molecular structure and morphology.
The incidence of the exposure period revealed a difference in the kinetic and rate of the production and consumption of the different chemical species. For all the ageing protocols, curve fitting of the FTIR spectra shows that the chemical species are practically the same, but their rate and final concentration are dramatically different. It has also been revealed that the dominant carbonyl species are aldehydes followed by ketones, acids and esters respectively. Also, the photo-oxidation rate is highly related to the exposure period, depending on temperature and solar energy [11-12], [23] [27-28].
Indeed, among all the ageing periods in this exposure site the one starting in April is certainly the most harmful since the carbonyl and vinyl concentrations as well as the crystallinity index are the highest. April being followed by summer one can expect that this hottest period of the year contributes to increase the degradation rate. Moreover, compared to the other protocols starting in the cold season the material shows a shorter induction time, which seems to promote the growth of the different chemical species (Fig. 6). The polymer is therefore more oxidized and the chain scissions seem to be the more relevant feature according to the concentration of vinyl groups (Fig. 7b). Crystallinity increases as well, consequently to the diffusion of the short chain segments towards the existing crystalline lamellae. It is well known that chain scissions are responsible for the loss of mechanical properties, while crystallinity makes the material more brittle and stiffer [15-16], [20].
Inversely, protocol 1 seems to be less deleterious in terms of final concentration of photo-oxidation products [12] (Fig. 6 and 7b).
A comparison between the oxidation kinetic curves and those of the crystallinity index shows that their variation are somewhat related. Therefore, oxidation followed by chain scissions leads to the reinforcement of the crystallinity degree (Fig. 8) via a chemo-crystallization process [29].
CONCLUSION
Solar energy is radiant light and heat delivered by sun. It is the most important factor affect the plastic films outdoor exposed. Such photonic energy can interact with the weakest sites of the macromolecular chains, leads to structural modifications mainly identified as oxidation, crosslinking and chain scissions. Additionally, to that, the overheating of the contact zone of plastic films with the greenhouse metallic support is another factor promote a rapid failure of the material.
A full analysis of the FTIR spectra has allowed the identification of most of the chemical species and to show how they are consumed or develop throughout ageing.
Curve fitting has been found to be a powerful tool for the identification of the chemical species constituting the complex and composite absorption bands of the carbonyls, and unsaturations. It revealed that the exposure of the films at different periods of the year does not affect the type of developing oxidation products but it is rather their kinetic which differ. It has also shown that aldehydes, carboxylic acids, ketones, and esters are the main oxidation products formed during ageing. A good correlation has been found between the just-mentioned carbonyl species and the vinyl groups. This feature seems to suggest that their formations are closely related and the mechanisms supposed to be common to these different species are the NI and NII process. Indeed, the kinetic formation of carbonyl groups is higher during the warm season and it is the same for the crystallinity degree. This argues for a higher chain scission activity which tends to follow the path of the oxidation mechanism passing essentially through the NII process, to which is added the contribution of the NI during this period.
References
- Lv, Y., Huang, Y., Yang, J., Kong, M., Yang, H., Zhao, J., & Li, G. (2015). Outdoor and accelerated laboratory weathering of polypropylene: A comparison and correlation study. Polymer Degradation and Stability, 112, 145-159.
- Briassoulis, D., Aristopoulou, A., Bonora, M., & Verlodt, I. (2004). Degradation characterisation of agricultural low-density polyethylene films. Biosystems engineering, 88(2), 131-143.
- Briassoulis, D. (2005). The effects of tensile stress and the agrochemical Vapam on the ageing of low density polyethylene (LDPE) agricultural films. Part I. Mechanical behaviour. Polymer degradation and stability, 88(3), 489-503.
- Verdu, J. (1984). Vieillissement des plastiques.
- Chabira, S. F., Sebaa, M., & G'sell, C. (2008). Influence of climatic ageing on the mechanical properties and the microstructure of low density polyethylene films. Journal of applied polymer science, 110(4), 2516-2524.
- Tavares, A. C., Gulmine, J. V., Lepienski, C. M., & Akcelrud, L. (2003). The effect of accelerated aging on the surface mechanical properties of polyethylene. Polymer Degradation and Stability, 81(2), 367-373..
- Gardette, M., Perthue, A., Gardette, J. L., Janecska, T., Földes, E., Pukánszky, B., & Therias, S. (2013). Photo-and thermal-oxidation of polyethylene: Comparison of mechanisms and influence of unsaturation content. Polymer degradation and stability, 98(11), 2383-2390..
- Yagoubi, W., Abdelhafidi, A., Sebaa, M., & Chabira, S. F. (2015). Identification of carbonyl species of weathered LDPE films by curve fitting and derivative analysis of IR spectra. Polymer Testing, 44,37-48.
- Chabira, S. F., Sebaa, M., & G'sell, C. (2012). Oxidation and crosslinking processes during thermal aging of low‐density polyethylene films. Journal of Applied Polymer Science, 124(6), 5200-5208.
- Colin, X., Audouin, L., & Verdu, J. (2007). Kinetic modelling of the thermal oxidation of polyisoprene elastomers. Part 3: Oxidation induced changes of elastic properties. Polymer degradation and stability, 92(5), 906-914.
- Gugumus, F. (2006). Physico-chemical aspects of polyethylene processing in an open mixer. Part 22: Mechanisms and kinetics of vinyl and vinylidene group consumption. Polymer degradation and stability, 91(9), 2061-2078.
- Salvalaggio, M., Bagatin, R. , Fornaroli, M., Fanutti, S.(2006).Multi-component analysis of low – density polyethylene oxidative degradation. Polymer Degradation and Stability, 91 ,2775-2785.
- Gulmine, J. V., & Akcelrud, L. (2006). FTIR characterization of aged XLPE.Polymer testing, 25(7), 932-942..
- Moez, A. A., Aly, S. S., & Elshaer, Y. H. (2012). Effect of gamma radiation on low density polyethylene (LDPE) films: optical, dielectric and FTIR studies.Spectrochimica Acta Part A: Molecular and Biomolecular Spectroscopy, 93, 203-207.
- films by multiple internal reflection infra-red spectroscopy. Polymer, 30(12), 2324-2327.
- Coates, J. (2000). Interpretation of infrared spectra, a practical approach.Encyclopedia of analytical chemistry.
- Gugumus, F. (2000). Physico-chemical aspects of polyethylene processing in an open mixer 2. Functional group formation on PE–LD processing. Polymer degradation and stability, 67(1), 35-47.
- Kondyurin, A., Kondyurina, I., & Bilek, M. (2013). Radiation damage of polyethylene exposed in the stratosphere at an altitude of 40 km. Polymer degradation and stability, 98(8), 1526-1536.
- Setnescu, R., Kaci, M., Dehouche, N., Setnescu, T., Nasri, L., & Zaharescu, T. (2015). Hydrothermal Ageing of Metallocene Polyethylene Films in Presence of Grafted Amine Stabilizers. Arabian Journal for Science and Engineering, 40(1), 69-80.
- Gugumus, F. (1990). Contribution to the photolysis of hydroperoxides in polyethylene. Polymer degradation and stability, 27(1), 19-34.
- Mistry, B. D. (2009). A handbook of spectroscopic data. New Delhi: Oxford Book Company.
- Carrasco, F., Pages, P., Pascual, S., & Colom, X. (2001). Artificial aging of high-density polyethylene by ultraviolet irradiation. European polymer journal,37(7), 1457-1464.
- Tireau, J. (2011). Propriétés à long terme des gaines de polyéthylène haute densité utilisées pour les ponts à haubans (Doctoral dissertation, Arts et Métiers ParisTech.
- Benítez, A., Sánchez, J. J., Arnal, M. L., Müller, A. J., Rodríguez, O., & Morales, G. (2013). Abiotic degradation of LDPE and LLDPE formulated with a pro-oxidant additive. Polymer degradation and stability, 98(2), 490-501.
- Dilara, P. A., & Briassoulis, D. (1998). Standard testing methods for mechanical properties and degradation of low density polyethylene (LDPE) films used as greenhouse covering materials: a critical evaluation. Polymer testing, 17(8), 549-585.
- Satoto, R., Subowo, W. S., Yusiasih, R., Takane, Y., Watanabe, Y., & Hatakeyama, T. (1997). Weathering of high-density polyethylene in different latitudes. Polymer Degradation and Stability, 56(3), 275-279.
- Fernando, S. S., Christensen, P. A., Egerton, T. A., & White, J. R. (2007). Carbon dioxide evolution and carbonyl group development during photodegradation of polyethylene and polypropylene. Polymer Degradation and Stability, 92(12), 2163-2172.
- Tidjani, A. (2000). Comparison of formation of oxidation products during photo-oxidation of linear low density polyethylene under different natural and accelerated weathering conditions. Polymer degradation and Stability, 68(3), 465-469.
- Roy, P. K., Surekha, P., Rajagopal, C., Chatterjee, S. N., & Choudhary, V. (2007). Studies on the photo-oxidative degradation of LDPE films in the presence of oxidised polyethylene. Polymer degradation and stability, 92(6), 1151-1160.
- Mendes, L. C., Rufino, E. S., De Paula, F. O., & Torres Jr, A. C. (2003). Mechanical, thermal and microstructure evaluation of HDPE after weathering in Rio de Janeiro City. Polymer degradation and stability, 79(3), 371-383.
Recieved: 24-05-2021 | Web published: 24-05-2021 | Views 1276